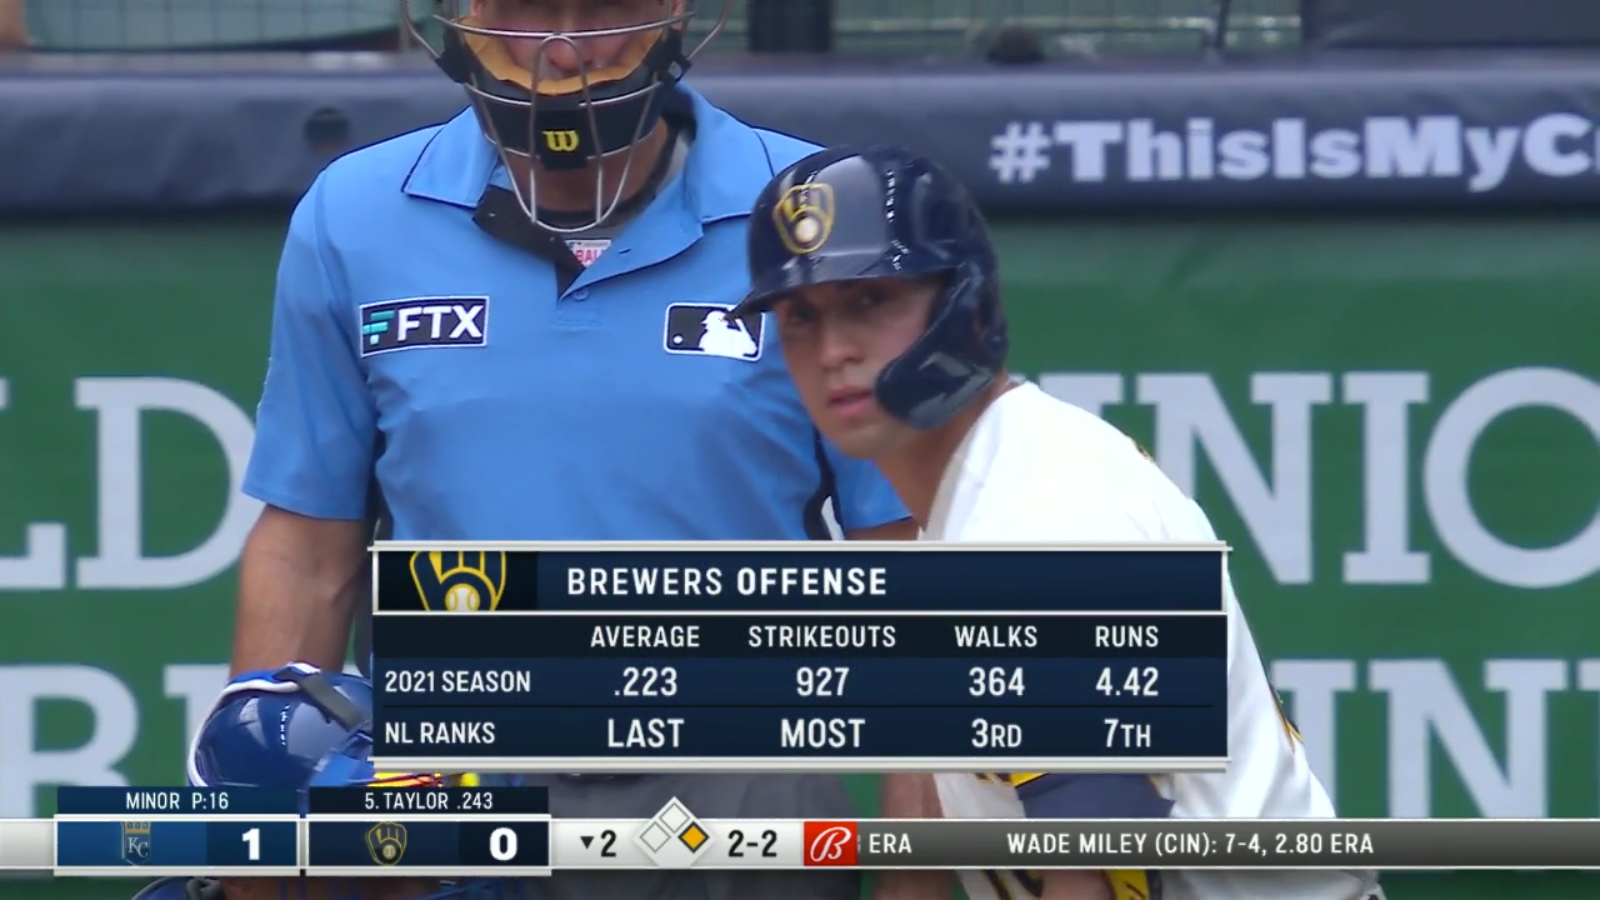
I was trying to enjoy my lunch break Peloton ride with #MyGuy Denis Morton while enjoying the afternoon Royals game when the broadcast put up this rather ominous stat graphic:

Knowing the Royals as I do, and all we as fans have endured over the past 15 years lifetime of games, I knew whatever discussion that accompanied this graphic had to be a good one. Take a listen:
…last in their league in batting average, they have the most strikeouts, the third most walks, and you put all that together and they’re in the middle of the pack in runs per game.
-Ryan Lefebvre
Set aside for a moment how much I do not concern myself with per-game stats (like runs per game), or even cumulative stats that look at the season as a whole and how stats “even out” over the course of 162 (they don’t), and focus on the insinuation that the Brewers are merely middle-of-the-pack in runs scored in the National League because they are last in batting average and have the most strikeouts.
Or, they’ve achieved middle-of-the-pack in runs scored, and have remained atop the NL Central standings because they walk a ton.
The other fun cherry-picking about this stat is the excluding of the rest of the majors leagues. While the Brewers may be 7th in runs in the National League, they’re 13th in all of baseball. Not a great spot, but certainly leaves less of the impression the Brewers are as bad on offense as the narrator would like you to believe given the context of the conversation.
For arguments sake, let’s take a look at where the Royals rank in those categories versus the American League:
| Average | Strikeouts | Walks | Runs | |
| 2021 SEASON | .244 | 744 | 251 | 4.10 |
| AL RANKS | 6th | 3rd BEST | WORST | 14th (out of 15) |
Hmmm. It looks like there may be a correlation between walks and runs scored.
But what do I know, I’m just a guy that crushed a Big Sur scenic ride on my lunch break.

